HOSPITAL READMISSION
Project Summary
The primary objective of this project is to predict hospital readmission using data for hospital admission. The secondary objective is to evaluate whether an initial diagnosis of diabetes can serve as a reliable predictor for hospital readmission.
The data contains patient information - age, initial duration at the hospital, tests, diagnosis (primary, secondary and tertiary) and readmission status. Given the target variable is categorical (yes/no) for readmission, two classification models were employed: Logistic Regression and Neural Networks.
For the Logistic Regression model, due to a high number of predictors, feature selection
techniques were applied to enhance model performance, like Backward Elimination, Forward Selection, and Stepwise Selection. While the Exhaustive Search method was excluded due to its high computational cost, a Grid Search was implemented to optimize the neural network model by identifying the most effective number of hidden layer nodes for improved performance.
For the secondary objective, to assess if diabetes can be used to predict hospital readmission, a graphical presentation was used to compare the results to other diagnoses to aid the data analyst to understand the effect to readmission; while the coefficients were used to finalize the conclusion. The application of the model shall help in better hospital operations - readmissions are costly and often indicative of gaps in care delivery. High readmission rates are associated with increased
healthcare expenses and poor patient outcomes. Predicting which patients are at high risk of readmission can enable healthcare providers to deliver preventative interventions and reduce overall readmission rates.
Introduction
Hospital readmission rates are widely recognized as a critical indicator of healthcare quality, efficiency, and patient outcomes. Elevated readmission rates often point to underlying systemic issues, such as insufficient discharge planning, inadequate patient education, or a lack of proper follow-up care. In the context of a healthcare industry moving steadily toward value-based care models, reducing avoidable readmissions has become a key priority. Addressing this issue not only improves the quality of care delivered to patients but also helps healthcare providers avoid penalties, reduce operational costs, and enhance long-term patient satisfaction and health outcomes.
Creating a comprehensive data analysis can significantly aid in identifying the factors contributing to readmissions, allowing healthcare providers to implement targeted interventions. This proactive approach not only benefits patients but also aligns with industry standards aimed at fostering accountability and excellence in healthcare delivery.
By leveraging the Kaggle hospital readmissions dataset, we were able to simulate real-world
hospital scenarios and develop predictive models that offer meaningful insights into readmission patterns.
Main Chapter
A. Develop the Understanding
- The primary objective of this project is to predict hospital readmission using data for hospital admission.
- The second objective is to determine if patients with diabetes can be used to predict hospital readmission.
- Once the model is created, it can be used to identify admitted patients' likelihood of readmission, and they may use it to improve hospital services to reduce it.
- One of the outputs of the project is to identify diabetes as a criterion of readmission, if this is determined, hospitals can adjust patient care targeting diabetes patients improved health care services.
B. Obtain Data for Analysis
To conduct our analysis on hospital readmissions, we first identified and sourced a publicly available dataset that provides relevant and comprehensive healthcare data. After exploring various repositories, we selected a dataset from Kaggle titled "hospital Readmissions".
This dataset includes detailed patient-level information from over 100,000 hospital encounters for diabetic patients. It contains variables related to demographics, admission and discharge details, medical diagnoses, length of stay, medications, and whether the patient was readmitted. Specifically, it allows us to investigate factors influencing hospital readmission, making it suitable for predictive modeling and exploratory analysis in our case.
C. Explore, Clean and Preprocess Data / Reduce the Data Dimension
1. Number of Records: 25,000
2. Number of Columns: 17
- Hospital Readmissions Dimension: (25000, 17)
3. Columns
Index(['age', 'time_in_hospital', 'n_lab_procedures', 'n_procedures','n_medications', 'n_outpatient', 'n_inpatient', 'n_emergency','medical_specialty', 'diag_1', 'diag_2', 'diag_3', 'glucose_test','A1Ctest', 'change', 'diabetes_med', 'readmitted'],dtype='object')
4. Column Data Types
age object
time_in_hospital int64
n_lab_procedures int64
n_procedures int64
n_medications int64
n_outpatie
nt int64
n_inpatient int64
n_emergency int64
medical_specialty object
diag_1 object
diag_2 object
diag_3 object
glucose_test object
A1Ctest object
change object
diabetes_med object
readmitted object
dtype: object
5. Converted Column Data Types
The fields that are non-numeric are converted to dummy variables to be used in the analysis. The result is 46 columns.
time_in_hospital int32
n_lab_procedures int32
n_procedures int32
n_medications int32
n_outpatient int32
n_inpatient int32
n_emergency int32
age_[50-60) int32
age_[60-70) int32
age_[70-80) int32
age_[80-90) int32
age_[90-100) int32
medical_specialty_Emergency/Trauma int32 medical_specialty_Family/GeneralPractice int32
medical_specialty_InternalMedicine int32
medical_specialty_Missing int32
medical_specialty_Other int32
medical_specialty_Surgery int32
diag_1_Diabetes int32
diag_1_Digestive int32
diag_1_Injury int32
diag_1_Missing int32
diag_1_Musculoskeletal int32
diag_1_Other int32
diag_1_Respiratory int32
diag_2_Diabetes int32
diag_2_Digestive int32
diag_2_Injury int32
diag_2_Missing int32
diag_2_Musculoskeletal int32
diag_2_Other int32
diag_2_Respiratory int32
diag_3_Diabetes int32
diag_3_Digestive int32
diag_3_Injury int32
diag_3_Missing int32
diag_3_Musculoskeletal int32
diag_3_Other int32
diag_3_Respiratory int32
glucose_test_no int32
glucose_test_normal int32
A1Ctest_no int32
A1Ctest_normal int32
change_yes int32
diabetes_med_yes int32
readmitted_yes int32
dtype: object
D. Determine the Data Mining Task
- The identified output column is “readmitted” with two outputs “Yes” or “No.” From “readmitted” it was converted to “readmitted_Yes” with either “0” or “1” value.
- The initial predictor variables are listed below:
Index(['time_in_hospital', 'n_lab_procedures', 'n_procedures', 'n_medications', 'n_outpatient', 'n_inpatient', 'n_emergency', 'age_[50-60)', 'age_[60-70)', 'age_[70-80)', 'age_[80-90)', 'age_[90-100)', 'medical_specialty_Emergency/Trauma', 'medical_specialty_Family/GeneralPractice', 'medical_specialty_InternalMedicine', 'medical_specialty_Missing', 'medical_specialty_Other', 'medical_specialty_Surgery', 'diag_1_Diabetes', 'diag_1_Digestive', 'diag_1_Injury', 'diag_1_Missing', 'diag_1_Musculoskeletal', 'diag_1_Other', 'diag_1_Respiratory', 'diag_2_Diabetes', 'diag_2_Digestive', 'diag_2_Injury', 'diag_2_Missing', 'diag_2_Musculoskeletal', 'diag_2_Other', 'diag_2_Respiratory', 'diag_3_Diabetes', 'diag_3_Digestive', 'diag_3_Injury', 'diag_3_Missing', 'diag_3_Musculoskeletal', 'diag_3_Other', 'diag_3_Respiratory', 'glucose_test_no', 'glucose_test_normal', 'A1Ctest_no', 'A1Ctest_normal', 'change_yes', 'diabetes_med_yes'], dtype='object')
E. Partition the Data
To ensure there is no overfitting, initial data was partitioned into 60% Training data, and 40% Validation data using the train_test_split function. Other models was adjusted accordingly - 80%/20% split, and 70%/30% split
F. Techniques
- Since the identified output variable is categorical rather than numeric, a classification model was used. It was identified to use Logistic Regression as the initial model, and the Neural Net was selected to ensure complicated relationships can be covered.
- Logistic Regression - a method of reduction through Forward Elimination, Backward Elimination and Stepwise was used to improve the accuracy of the model.
- Neural Nets - to refine the model, GridSearch was used to better improve the result.
G. Charts, Algorithm and Measures
LOGISTIC REGRESSION MODEL
Bar Chart for Data Visualization of Diagnosis Readmission

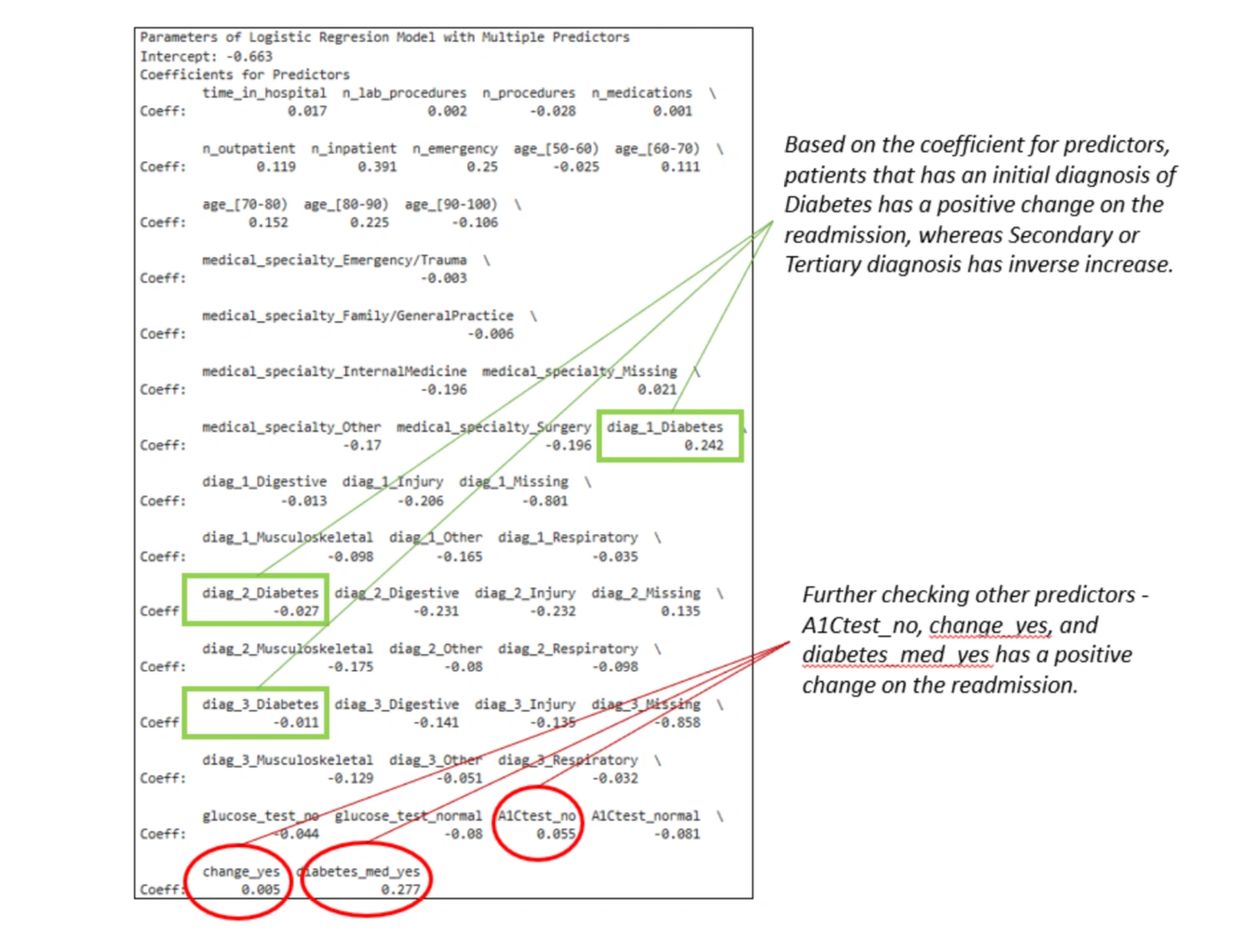
The Logistic Regression Model with Multiple Predictor


Gains Chart
- The blue curve shows the cumulative number of actual readmissions correctly identified as we move through the top-ranked predicted records (sorted by predicted probability)
- The model is better than random, as the blue line stays above the baseline.
- But it doesn’t rise steeply - indicating limited lift.
Lift Chart
- Top 10% (decile 1) has a lift of 1.6
- The top 10% of predicted patients are 1.6× more likely to be true readmissions than
- random guessing.
- The model performs reasonably well in the top decile.
- Lift quickly drops in later deciles, indicating limited separation power.


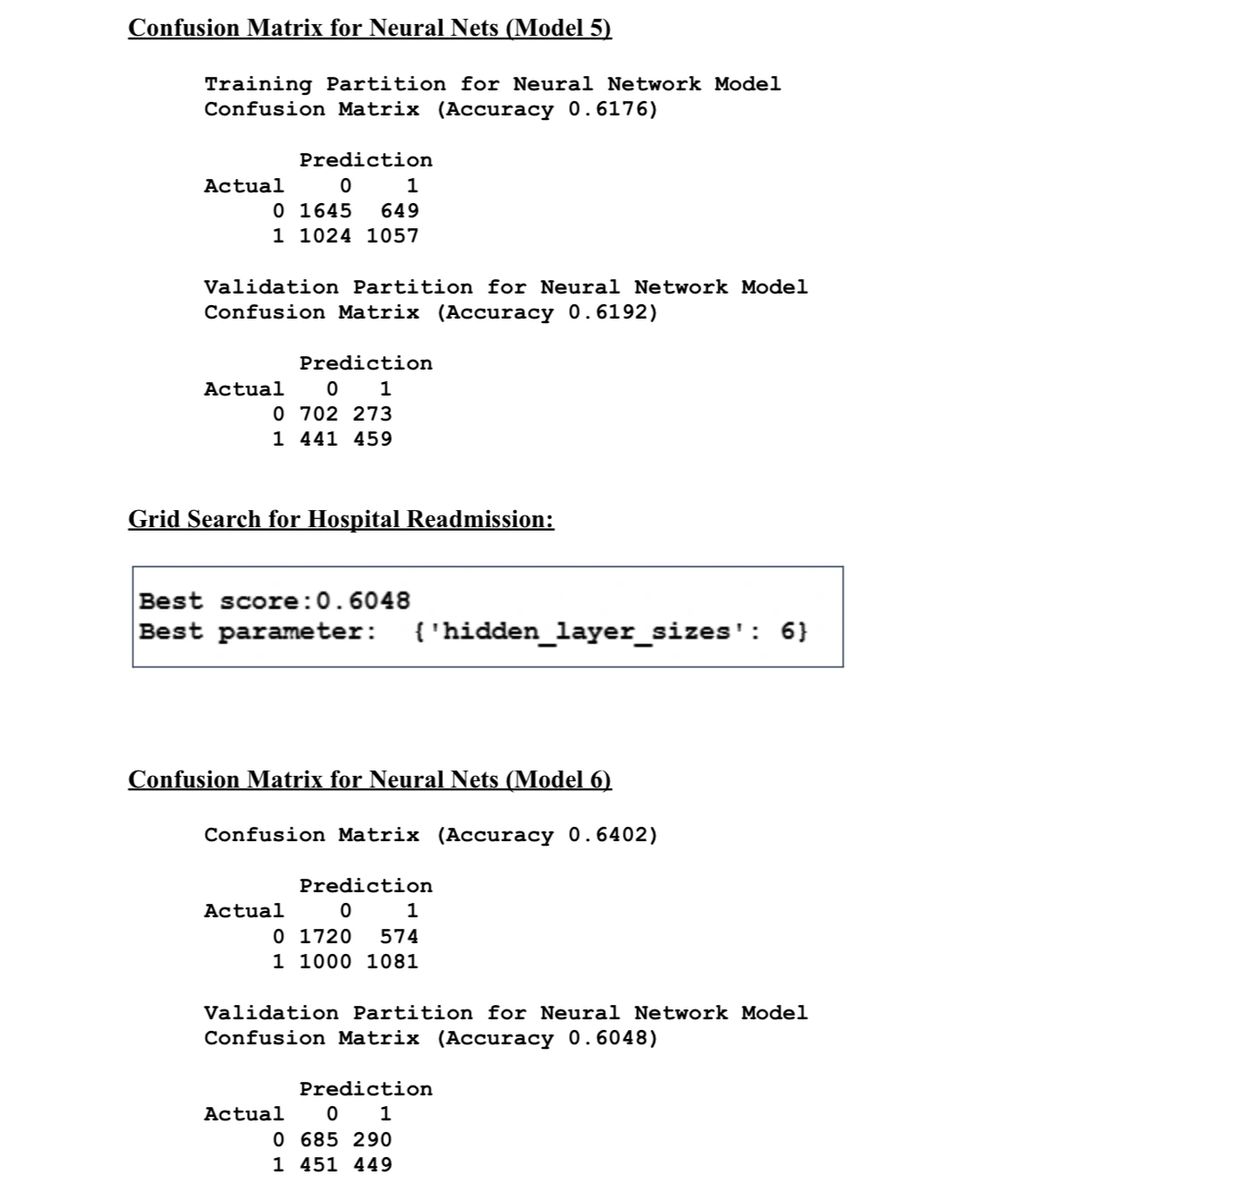

- All models' respective confusion matrix results indicate no overfitting (the training and validation result is close to each other)
- Logistic Regression comparison - Model #1 to Model #5 provided almost the same results of approximately 60%. The Backward Selection, Forward Selection and Stepwise reduction method provided no significant improvement.
- Neural Nets - initial model performed better even if the second model was enhanced using the Gridsearch.
I. CONCLUSION
Primary Objective
The initial Logistic regression model (Model #1), with a confusion matrix accuracy (validation) of around 61.57%, yields acceptable results using the full predictors of the data set.
The revised model (Model #2), and models using backwards elimination algorithm, forward elimination and stepwise resulted in almost similar accuracy of around 60% but still below the initial model - which provided no advantage.
The Neural Nets model (Model #6) yielded a confusion matrix accuracy (validation) of 61.92%, a little higher compared to the best Logistic Regression model (difference of 0.35%). Though GridSearch was used to improve performance, it did not improve the
accuracy making the original Neural Net (Model #6) performance better than all other 6
models.
Secondary Objective
Based on the coefficient for predictors, patients that have an initial diagnosis of Diabetes have a positive change on the readmission, whereas Secondary or Tertiary diagnosis has an inverse increase.
Further checking other predictors - A1Ctest_no, change_yes, and diabetes_med_yes has a positive change on the readmission.
Overall, the project has achieved a model that can predict a 61.92% accuracy for current
admitted patients with the focus on patients with initial diagnosis of diabetes (with no changes on A1C test, with changes in diabetes medication and prescribed diabetes
medication). With this the hospital can improve providing better health care services by
predicting which patients are at high risk of readmission and to enable healthcare providers to deliver preventative interventions and reduce overall readmission rates.
/END
BIBLIOGRAPHY
This website uses cookies.
We use cookies to analyze website traffic and optimize your website experience. By accepting our use of cookies, your data will be aggregated with all other user data.